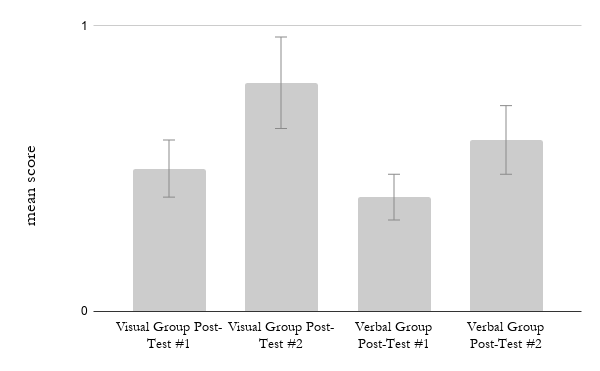
chart (1) 01/10/2019 Return to: Using Visual Explanations Leads to Better PerformanceFull resolution (600 × 371) Image navigation Previous Image Next Image Post Test #1 and Post Test #2 score for the verbal group (written explanation) and the visual group (diagramatic explanation)