
Schools have a duty to let parents and carers know how well their children are doing. But assessment is complicated and there are important concepts which are challenging to explain. A child’s score is straightforward, but not what the score means. We can describe how well a child is performing in relation to others in the class, but generally not how they performing compared to their peers nationally and internationally. Even if we can compare within a subject, it is difficult to compare between subjects. Finally, we’d like to be clear about how confident we are in the result: does it really tell us how well the child is doing?
So, how can we provide useful information to parents clearly and honestly?
Our approach at Paradigm Trust
We have spent a lot of time trying to address the issues above and we’ve developed some strategies.

- We standardise our assessments so that a score of 100 is our threshold for expected (the same as the Key Stage 2 SATs), and our score of 110 is the threshold for greater depth. This is familiar to parents whose children have done their SATs. It allows parents to compare how their child is performing in different subjects. Where possible, we tie our 100 and 110 scores to national standards. (I will describe how we do this in a future post).
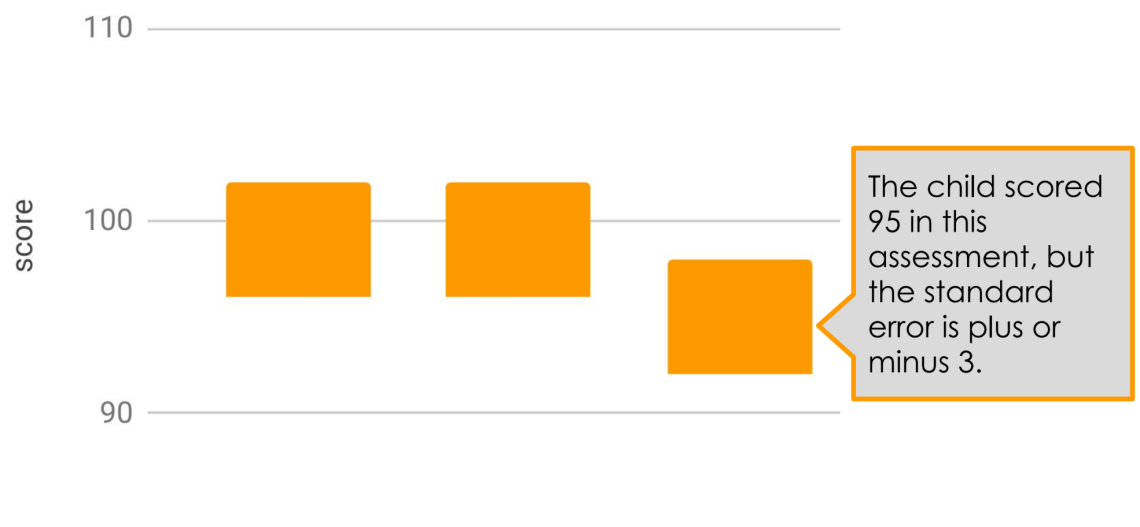
- For each assessment, we calculate the standard error of measurement – SEM (I described SEM in this post and will explain how we calculate it in a post next week). We know an assessment doesn’t give us perfect precision and we can measure the uncertainty. We want parents to understand that if a child scored 105 in October and 103 in February, their child probably isn’t falling behind.
- We present the data to parents as a chart. The top edge of the box shows the highest likely performance of the child and the bottom shows the lowest.
In the plot above, you can see that the pupil is working towards the expected standard in science, but is clearly between expected and greater depth in RE. The boxes which straddle the 100 line show that the pupil is broadly at the expected standard – one assessment might put them slightly above, another slightly below.
We still provide traditionally worded performance descriptors, but we hope that over time parents and carers will find the chart clear, helpful and honest.
Ben

Hi Ben,
We are busy reviewing our KS3 and KS4 reporting methodology to parents so that we can communicate effectively with them. Are you using this approach at KS3, or re you just using it at primary level?
Any input or suggestions you could pass on would be much appreciated!
Thansk
LikeLike
Hi Barry – we’re using it this summer KS1-3. KS3 parents who we’ve trialled it with liked it. It will be as an additional sheet this time so that parents can choose which one they prefer. It’s also easier to train the students to explain to parents at high school (assembly/form group). Ben
LikeLike
Hi Ben,
Thanks for this, i appreciate that you’ve mentioned you will explain in an upcoming blog post but i was wondering how you standardised the tests at KS3 to give you your 100 score?
Also how are the parents of students who score in the lower ranges about this approach?
Thanks
LikeLike
Hi Barry – I meant to include this in one of my other posts, but missed it. I think it merits a post of its own, as it’s one of the most important issues facing in-school assessment. You will have to give me a couple of days 🙂
As for reporting the scores – it seems to me that if we believe we’ve measured performance accurately, we have a duty to share that with parents and carers. Previously we reported whether pupils are at working at the expected standard, working towards the expected standard or working at greater depth – parents seem comfortable with this. A number adds precision/scale and the confidence intervals show how certain we can be. I think it’s better.
LikeLike