
The slides are here
Category: literacy
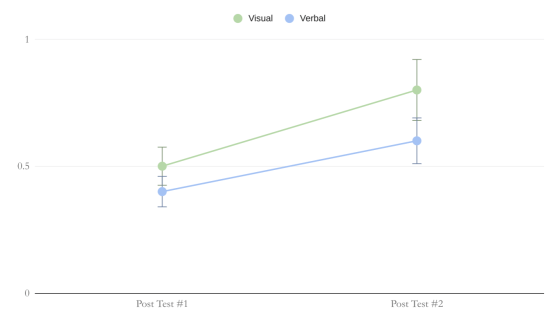
Empirically Better Graphics
You have two different ways of representing some information. Which way is better? One method is called AB testing. I … More

Introducing A Model of Behaviour Choices
I haven’t written about behaviour before as I didn’t have anything original to say. Teach Like a Champion did more … More
Using A Fishbone Diagram for Writing Cause and Effect Texts
Morning – just a quick post on using a fishbone diagram to help students write more focused cause and effect … More
Why Gestures are Important
This post summarises the findings of a paper by Barbara Tversky: Gestures for Thinking and Explaining (2005). The author demonstrates … More
Using Visual Explanations Leads to Better Performance
I have been listening to Barbara Tversky’s wonderful new book: Mind in Motion, about the roots of thinking in the … More
Communicating Physics in the Grid
Last weekend, my friend, a graphic designer, recommended this book by Joseph Muller-Brockman. It’s central message is that text and … More
How Seductive Details Do Their Damage
I have been doing my homework on using images for learning and found this great 1997 paper by Harp and … More
How Good Are Our Multiple Choice Questions?
At Paradigm Trust we have developed an assessment programme based on comparative judgement combined with multiple choice questions. The reasoning … More
Telling Stories in Science with Bar Charts
The formula ΔQ=mcΔθ tells a story. It describes the relationship between temperature and thermal energy in an elegant, succinct and … More
