

This is the final post in my week long series on assessment and reporting at Paradigm Trust schools.
Monday: Exploring Comparative Judgement Data With Charts
Tuesday: Communicating Assessment Scores with Parents and Carers
Wednesday: How Good Are Our Multiple Choice Questions?
Thursday: What Do We Do With the Multiple Choice Data?
Today’s post (Friday) is a jump. My colleagues at Paradigm Trust were already busy evaluating our assessments and we don’t really need a new statistical tool, but Rasch is too useful to ignore.
Back in November, a group of us went to ResearchEd Ipswich. Deep Ghataura gave a talk on using the Rasch model to measure question difficulty. It’s taken six months, but now we are using Rasch to help us evaluate our multiple choice questions.
Rasch allows us to:
- measure the performance of a learner (useful)
- measure the difficulty of a question (it allows us to predict the probability of a certain child answering a specific question correctly. We may find a use for that!)
- measure the infit (quirkiness) of a question (useful when we rewrite the questions)
- measure the infit of pupils’ performances in a test (do they have odd gaps?)
- measure the standard error of a pupil’s score (really useful for an honest understanding of assessment scores).
In other words, it’s almost miraculous. We’ve found these measures in our NoMoreMarking data (which also uses Rasch) so helpful, that we’ve developed a multiple choice analysis spreadsheet to analyse and present data in a comparable way.
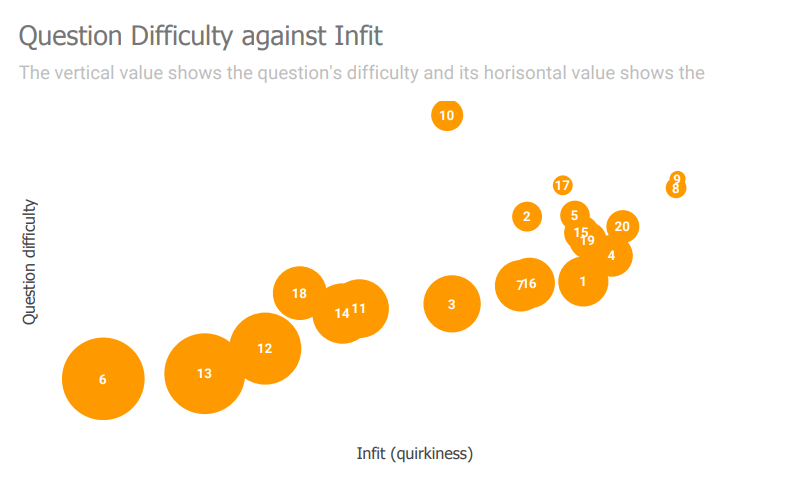
In the chart above, question 10 is challenging and not too ‘quirky’ – the high scoring learners mostly got it right, and the low scoring pupils mostly got it wrong. Question 8 got an unusual response. When we went back to the question, we found it was phrased badly. We have improved it for next time.
The assessment above was also unbalanced – we have several easy questions (6, 13, 12) and not enough challenging questions. We can address that next time.


Our Rasch spreadsheet (here) is easy to use, but probably less robust than commercial packages (here): you are welcome to have a go. I’ve locked all of the tabs to view only, except the raw data tab, where you should add your dichotomous MCQ data (1 for correct, 0 for incorrect).

The other tabs have the data listed above and some pretty data visualisation for the questions. You should be able to ‘look-under-the-bonnet’ to see the formulas if you like that sort of thing. I can’t recommend this Rasch textbook highly enough.
I’d recommend you make a copy for your own data. Please let me know if you have success (or spot errors) – it’s still early days with this for us.
Although Deep Singh Ghataura (@DSGhataura) ‘s ideas and influence runs through this post – the mistakes are all mine 🙂
Ben
